Billing Comparison. Billing Comparison between in-house billing vs outsource billing with California Medical Billing in Rancho Cucamonga, CA.
Know your numbers and Improve Your RCM
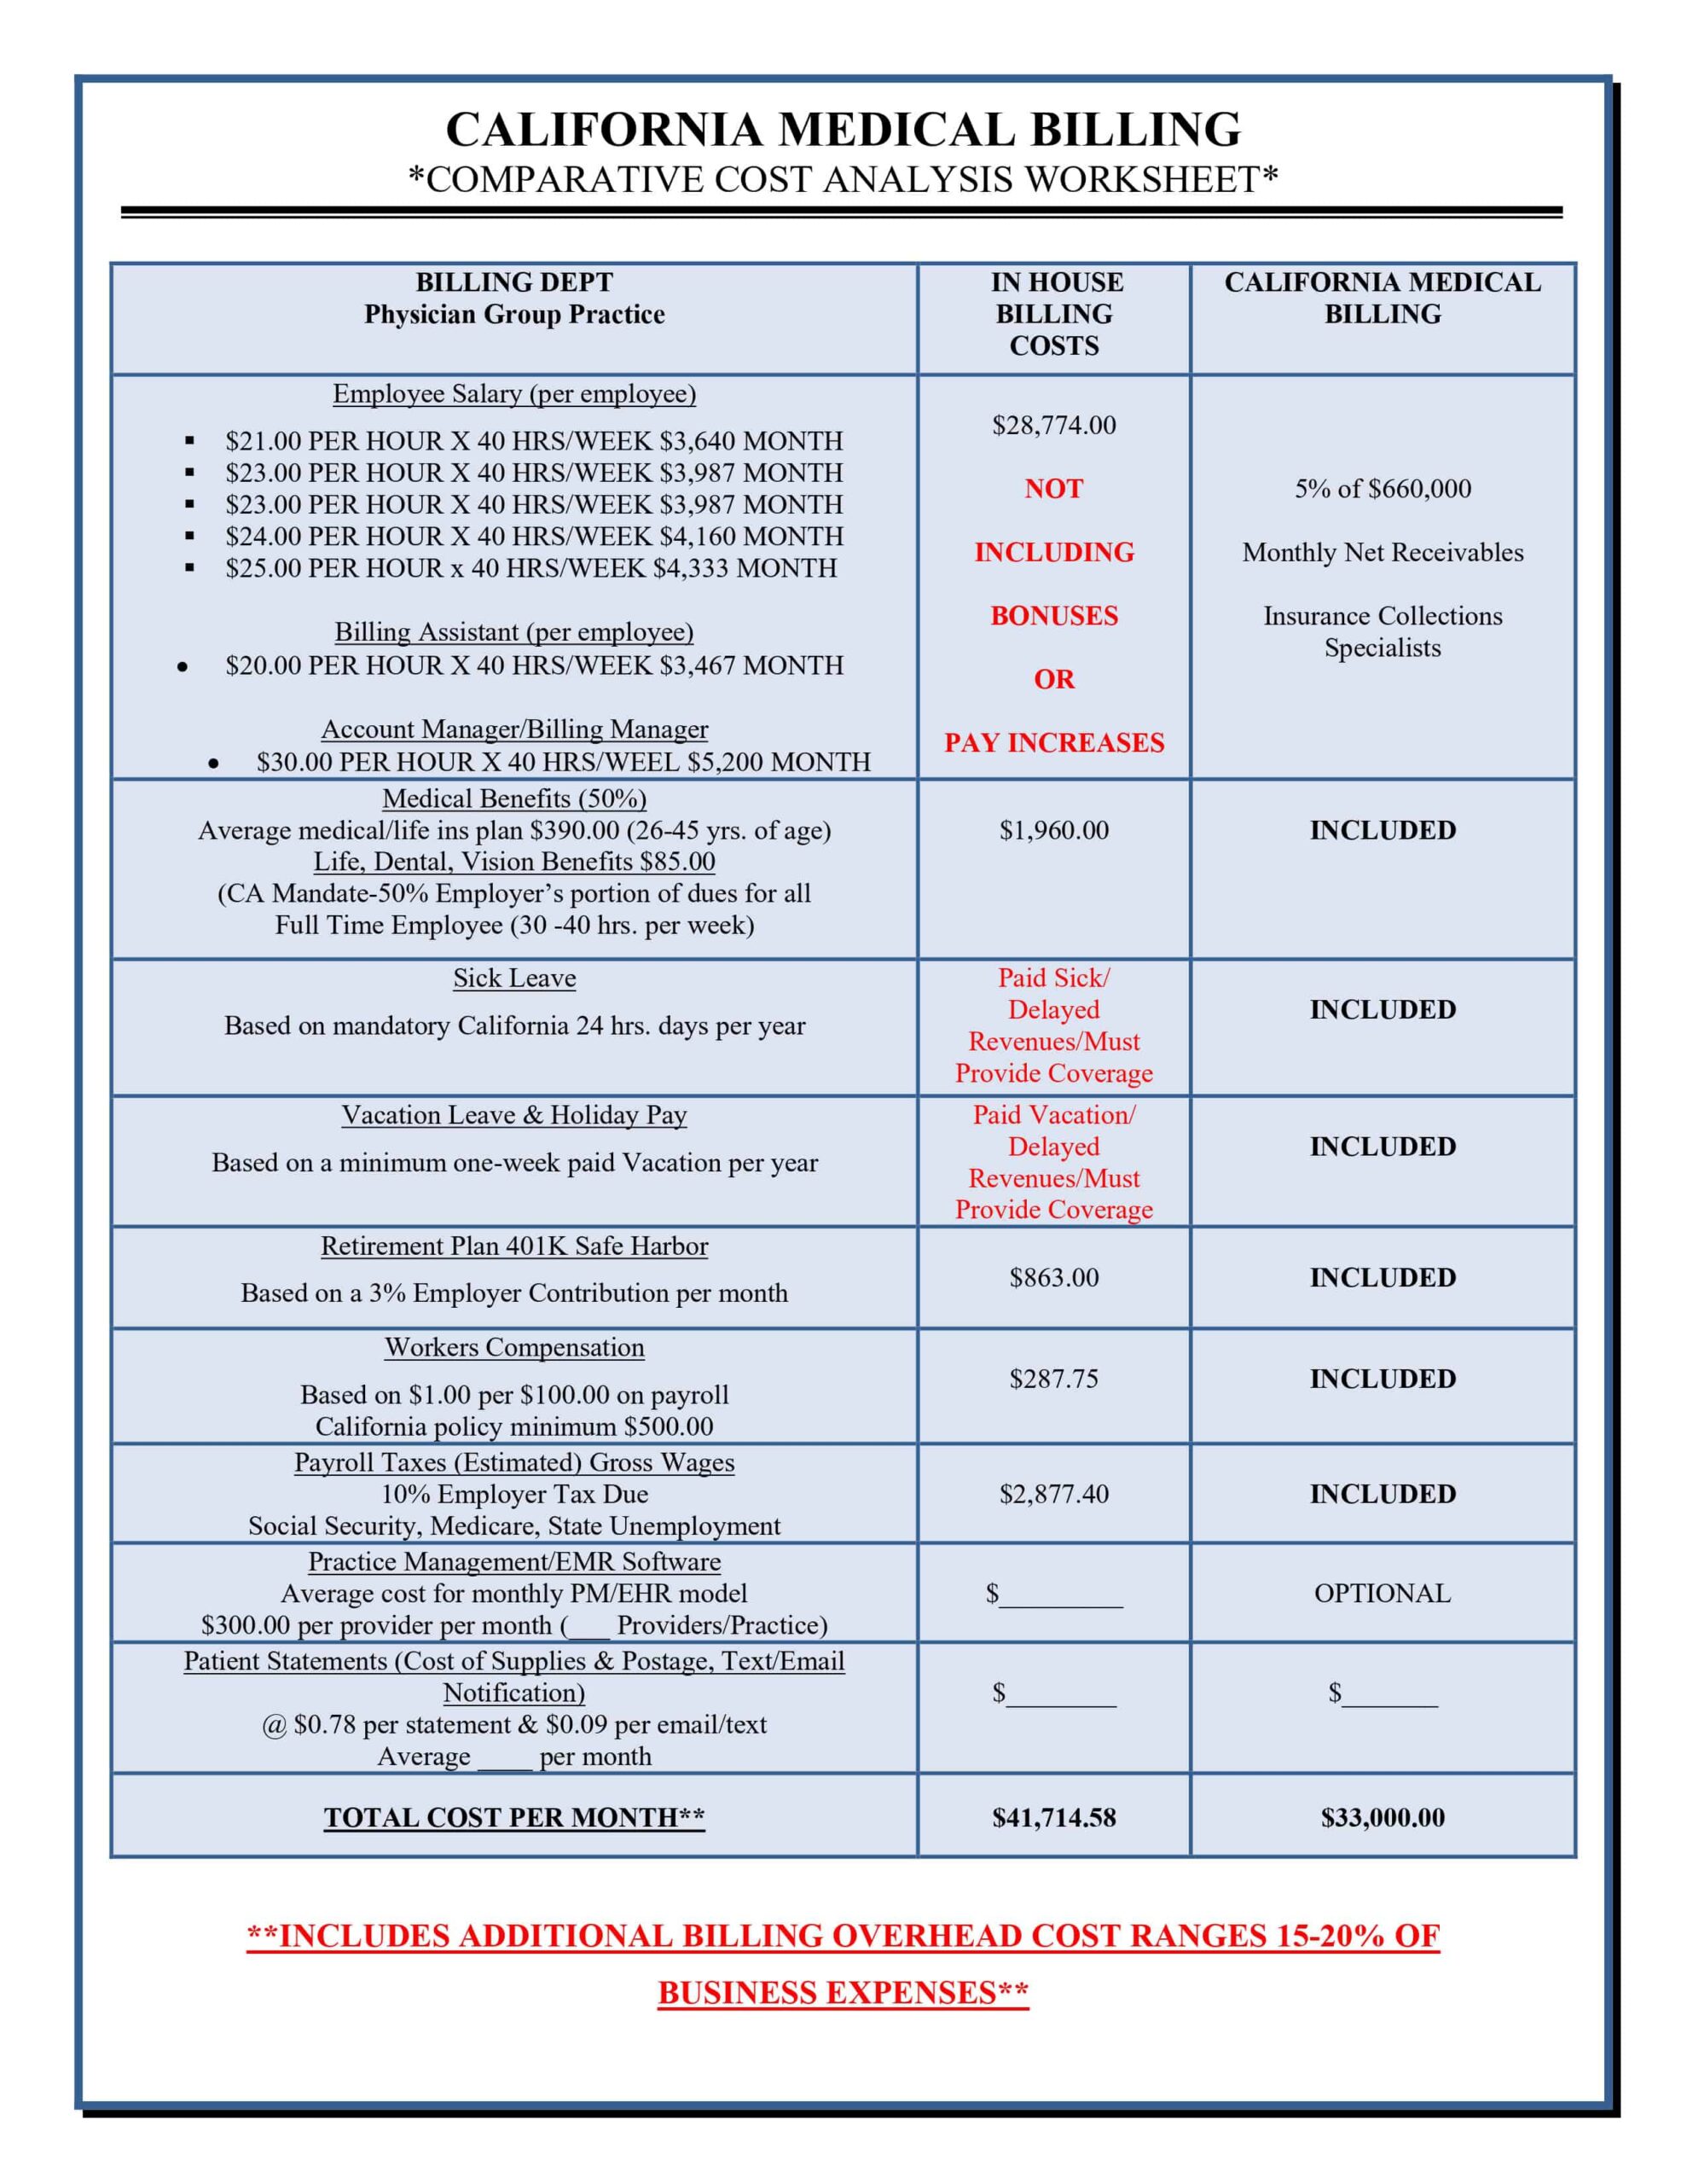
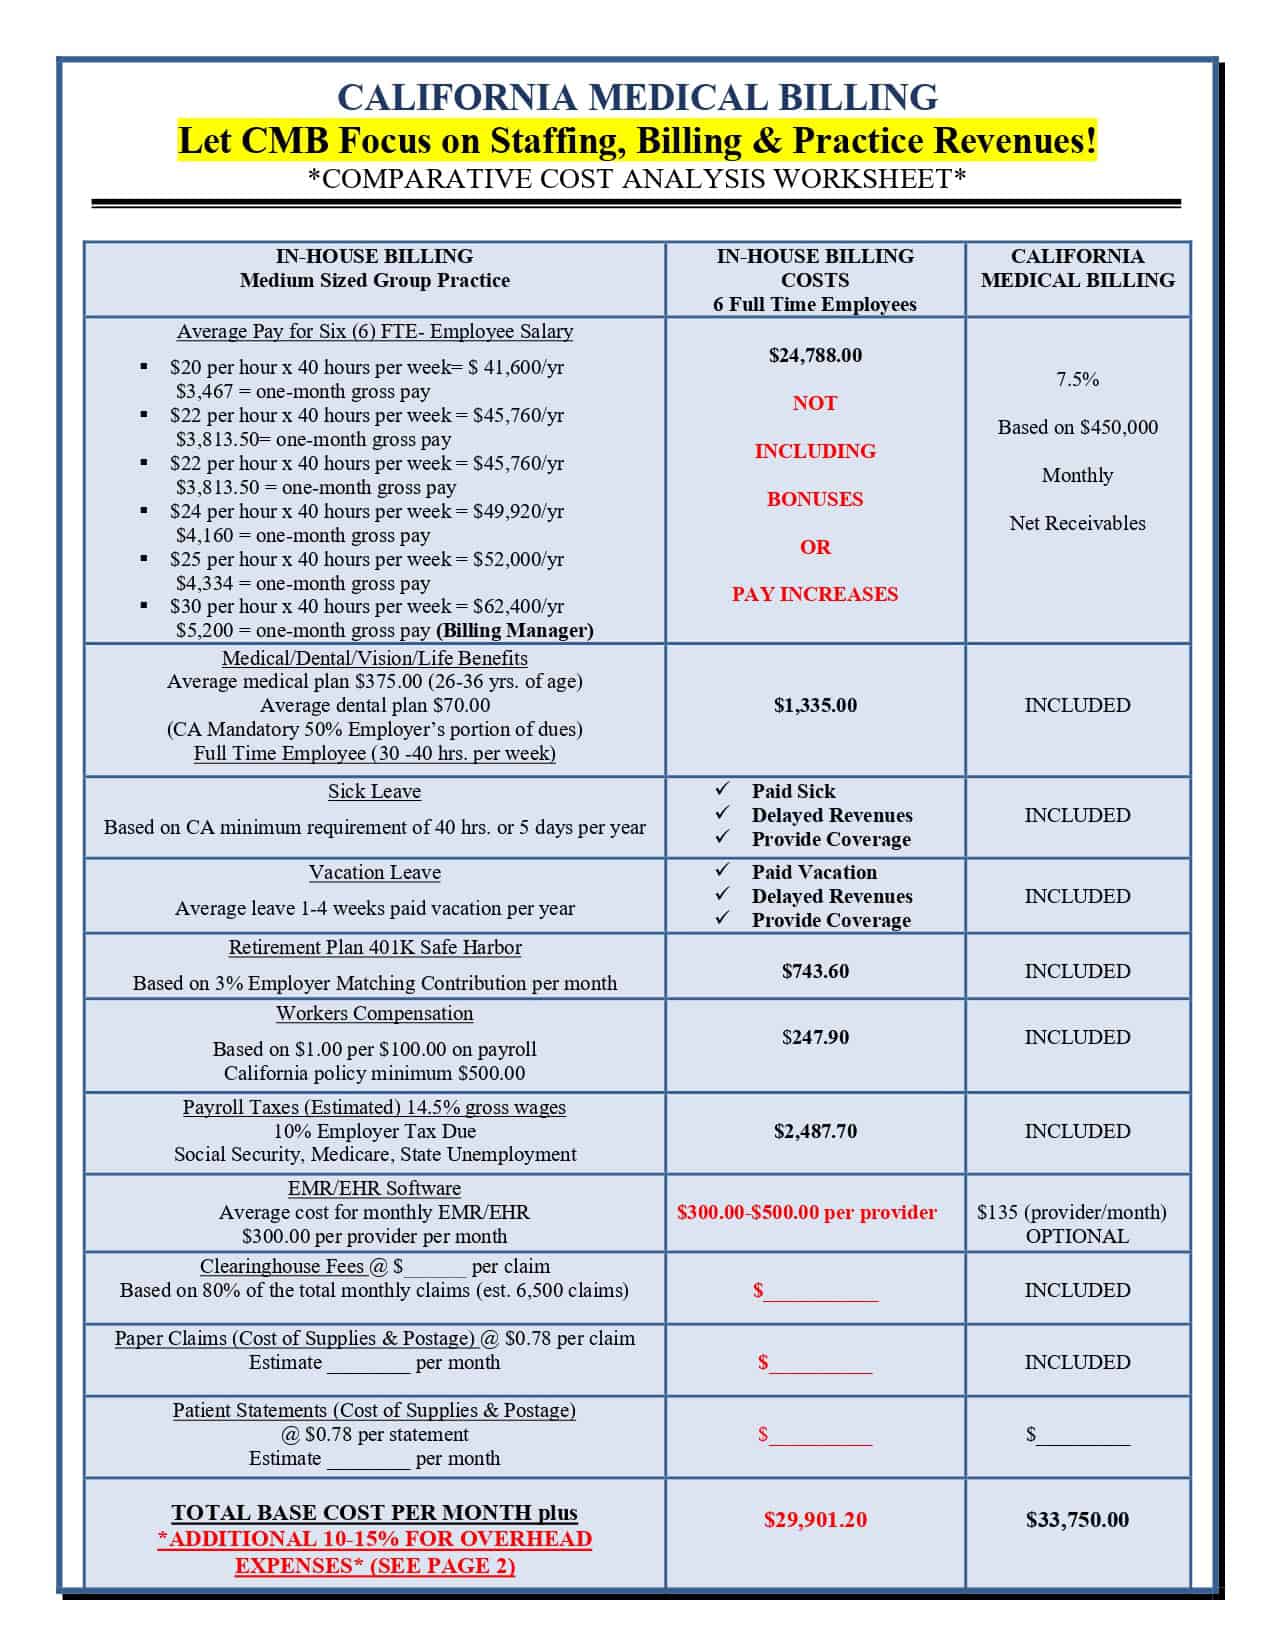
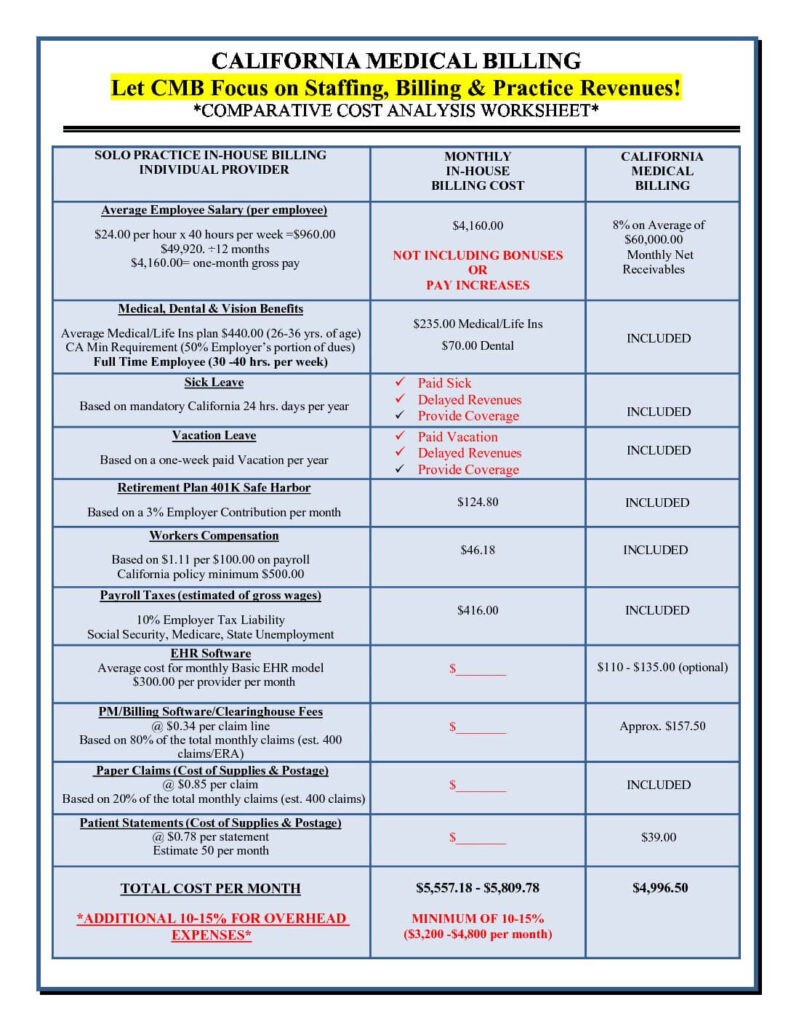
In-House Physician Group and Solo Practice Calculator
We are on a mission to change the conversation about what it takes to improve Revenue Cycle Management for doctors.
Because at the end of the day, it’s how much money you collect that matters most to your practice’s bottom line.
To help you make the best decision for your practice, we’ve created a specialized calculator to help you to better assess the costs and benefits of employing an in-house billing team.
*For demonstration purposes only.
| Specialty | |
| How many providers in the practice? | |
| Total Annual Revenue Collected | |
| Average Collections Rate from Insurance and Patients | |
| Your average annual insurance collections rate. If unknown, default to 90%. Unless you have documentation, this can be as low as 86%. | |
| Total Value of Claims at 100% | |
| Lost revenue (value of claims – revenue collected) | |
| At California Medical Billing and Revenue Management (CMB), our average collections rates range between 95–97% annually. Please note that this isn’t a promise or guarantee. Each practice is unique. | |
| Total Lost Revenue and Costs for In-House Billing | |
| The total lost revenue is an estimate based on your answers. It includes all the costs and the lost revenue from your average in-house collections rate of . | |
| In-House Billing Department | Answer |
|---|---|
| How many full-time billers do you have on staff? | |
| Average Salary per Hour (Full-Time Employees) | |
| How many part-time billers do you have on staff? | |
| Average Salary per Hour (Part-Time Employees) | |
| How many Billing Managers do you have on staff? | |
| Average Salary per Hour (Billing Manager) | |
| Total Employee Annual Base Salaries | |
| Employee Benefits (40% of salary) | |
| The average benefits and overhead burden for doctors in California is 40% of salary. This includes payroll taxes, health insurance, SDI, and CalSavers obligations. | |
| Total Employee Annual Salaries (including Employee Benefits) | |
| Utilization & Hidden Costs | Answer |
| Employee Utilization rate (time spent on billing) | |
| If you’re unsure, the rate defaults to 60%. Utilization rates include average PTO and vacation leave. Benchmark for high-performing teams is 80%; average for most medical practices is 60%. The 20% gap represents lost revenue / idle payroll cost that impacts your ability to collect all revenues owed. | |
| Idle costs due to poor utilization | |
| Staff Turnover Cost | |
| The average annual turnover for medical billing professionals is 33%, and replacement is estimated at 60% of salary. | |
| Physician Time Managing Billing Staff (hrs/provider/yr) | |
| Estimate hours your physicians and/or administrator spend resolving billing issues, reviewing reports, and managing staff. If unknown, attribute 2 hours per week per provider (≈104 hours/year per provider). | |
| Physician Opportunity Cost | |
| $250/hr is a conservative estimate. Physician billing rate is typically $250–$400/hr. | |
| Practice Management Software | |
| Average $300 per provider per month, or $3,600 annually. | |
| Estimated total annual costs | |
Please note that not all in-house costs are shown in the calculator. Other costs associated with employing your in-house billing team include:
Call us today to compare our rates and see how your revenue could increase.